

It's here: The Downballot's 2024 presidential results for all 435 House districts
Our new data represents the gold standard for district-level calculations


The Downballot is thrilled to announce the completion of our project to calculate the results of the 2024 presidential election for each of the nation's 435 congressional districts—an indispensable tool used by everyone who analyzes House races.
You can find a permanent, bookmarkable link with numbers for every district here. You can also access our data hub by saving this short URL: https://the-db.co/presbycd.
Why Our Data Is The Gold Standard
The Downballot's calculations, which we've provided to the public since 2008, represent the gold standard when it comes to presidential results by district. Our deep expertise and methodical approach ensure our data is of the highest accuracy.
You may be surprised to learn that very few states publish election results at the district level, even though all could do so easily. Instead, we have to manually gather precinct-level results from hundreds of counties—some of which don't even post them online—then clean that data and transform it into easily digestible district-level numbers.
It's a complex and labor-intensive process that, due to flaws and inconsistencies in the underlying data, requires a lot of problem-solving. Fortunately, we have long experience solving those problems: This is now the fifth presidential election for which we've calculated district-level results. We've also recalculated them following two rounds of nationwide redistricting and five instances of mid-decade redistricting in individual states.
In addition, it's not a quick process. Most states don't finalize their official results until a month or more after Election Day, and many counties take much longer to publish their returns. (It's also a mistake to try to use unofficial results, which often change—sometimes dramatically—by the time they're certified.) Careful cleanup and calculations take many more hours still.
It's our immense pleasure, though, because creating (and recreating) this set of data every few years is our calling. And it's now widely used by people of all stripes: journalists, activists, political professionals, academics, organizers, enthusiasts, and more.
Our data has been adopted so broadly because we provide much more than just the topline figures. We also:
Show our work by publishing detailed spreadsheets that include all of our calculations, including breakdowns for each county and partial county that make up each district.
Share the raw, precinct-level election returns we rely on.
Publish a user-friendly archive of historical data stretching back almost two decades.
And provide a detailed statement of methodology explaining exactly how we address the issues presented by imperfect election data.
If you value all our hard work in compiling this data—and especially if you plan to use it for your work—we'd be incredibly grateful if you'd become a paid subscriber.
What the Data Tells Us
So, we're sure you're asking, what does the data tell us? Quite a lot!
Election watchers typically start their analysis of any given congressional race by looking at the district's presidential numbers because, for many years, they've closely correlated with House outcomes.
The Decline in Split Tickets
This is vividly illustrated by the decline in the number of "crossover" districts: seats won by one party's presidential nominee but by the other party's House candidate. In 2024, there were just 16 total crossover districts: three that voted for Kamala Harris but elected a Republican to the House, and 13 that backed Donald Trump yet voted for a Democrat downticket.

That small number reflects a recent trend toward greater partisan polarization and less ticket-splitting. According to the Brookings Institution, there were 100 or more such districts during most of the post-war era, but by 2016, there were only 35, and that figure dropped to just 16 following the 2020 elections. The proportion jumped to 29 following the most recent round of redistricting but is now back down to 16.
In total, Trump won 230 districts versus 205 for Harris—exactly the same margin he rang up in 2016, despite performing better in the popular vote last year. (In between, Joe Biden managed a 224-211 edge in districts won, prior to redistricting.)
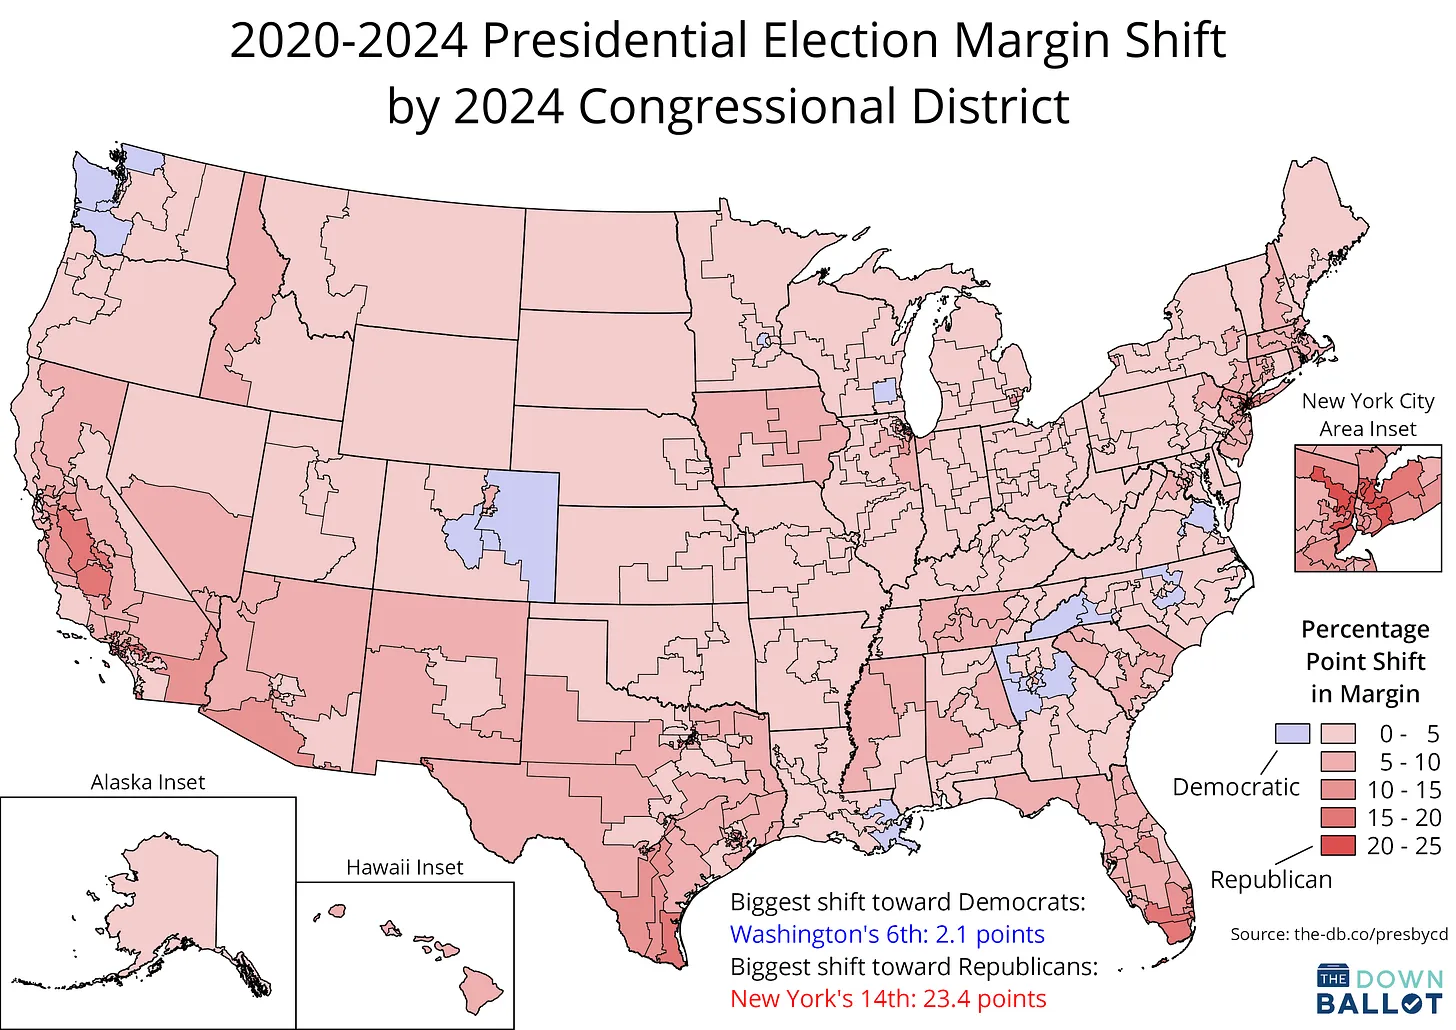
You can see these results plotted in the map at the top of this post, while our unique "hexmap" just below shows each district as equally sized so that small urban districts are visible and large rural districts don't dominate misleadingly.

The nation moves rightward
We can also see just how broadly the country moved to the right in 2024: Harris improved on Biden's margins in just 19 districts, while Trump bested his 2020 performance in the remaining 416.
The sharpest red shifts came in heavily Latino districts concentrated in California, Florida, New Jersey, New York, and Texas. The largest was in New York's 14th District, a slice of the Bronx and Queens represented by Democratic Rep. Alexandria Ocasio-Cortez. While Biden had carried the district by a 77-22 margin, Harris prevailed by a considerably smaller 65-33 edge—a drop of 23 points.
The biggest move to the left, meanwhile, was much smaller: Harris won Washington's 6th District in the Tacoma area, which is held by Democratic Rep. Emily Randall, by a 58-39 spread, just 2 points better than Biden's 57-40 showing. These shifts are shown below (click here for a traditional map).

Nineteen districts flipped from Biden to Trump, while none went the other way. The steepest decline in this group came in New Jersey's 9th District just outside of New York City, which plummeted from a 59-40 edge for Biden to a 49-48 win for Trump. As a consequence, Democrat Nellie Pou defeated her Republican opponent just 51-46, even though the district had typically not been competitive in the past.
Beating the top of the ticket—or getting beat
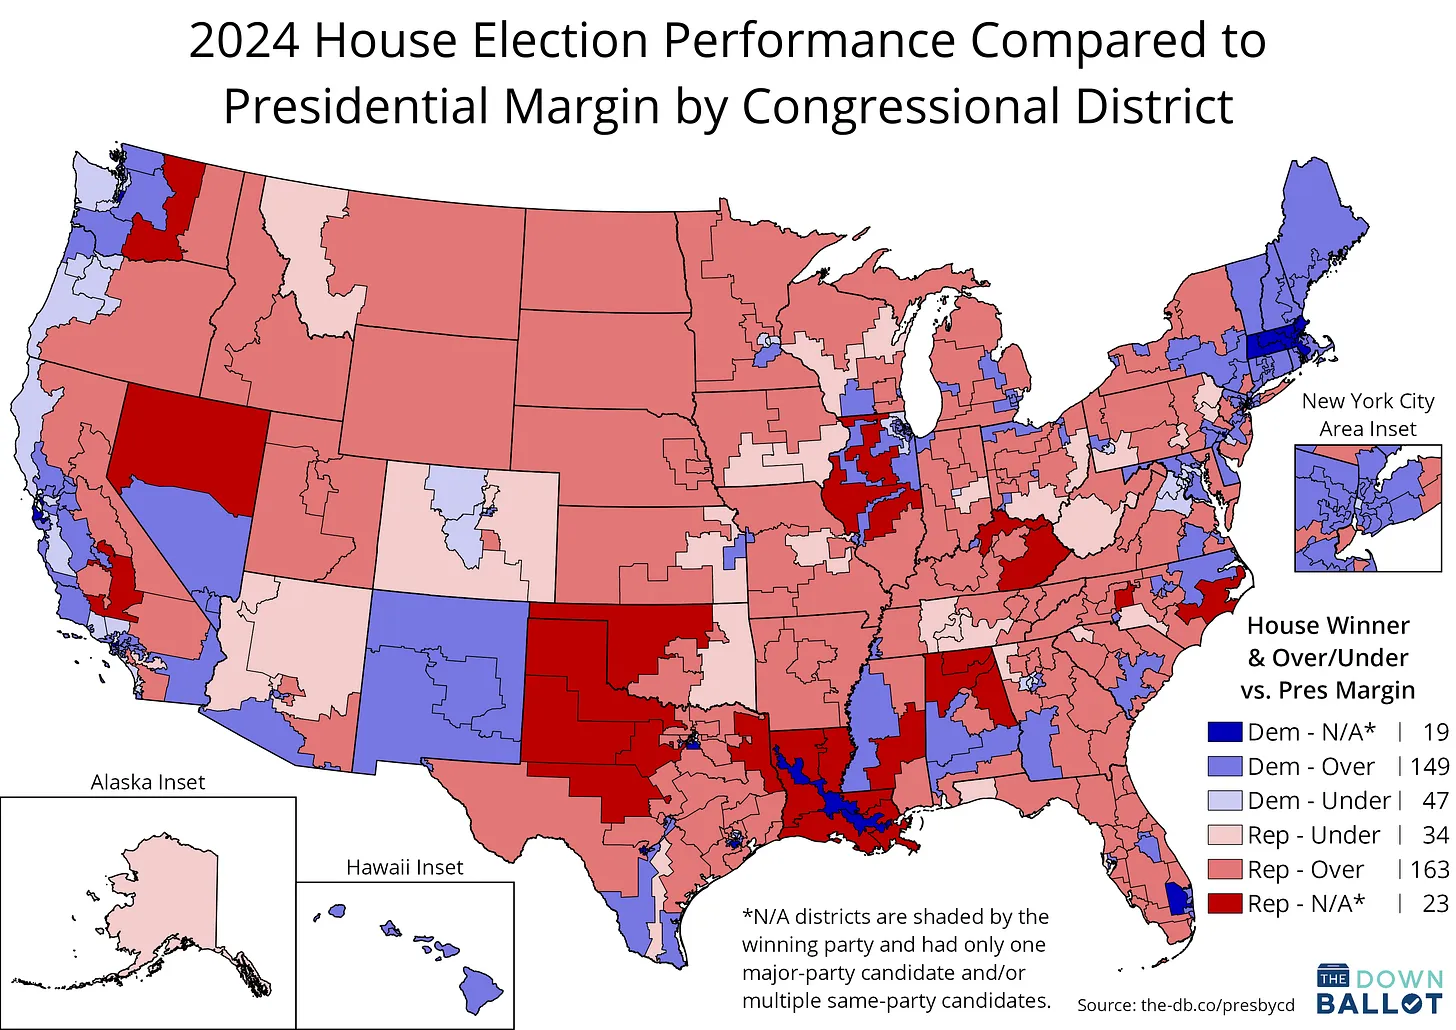
Pou, however, managed to outrun the top of the ticket—something a number of Democrats managed to pull off in some of the most hotly contested races, best illustrated by the larger number of Democrats in crossover seats. As a result, Republicans won just a 220-215 majority in the lower chamber, one seat narrower than the edge they'd enjoyed following the 2022 elections.
Overall, though, a greater proportion of GOP winners ran ahead of Trump compared to the share of Democrats who ran ahead of Harris. In total, 163 Republicans beat Trump while 34 trailed him; 149 Democrats exceeded Harris' margins while 47 ran behind. (The remaining 42 races were either uncontested or featured multiple candidates from each party, making an apples-to-apples comparison impossible.)
Over- and underperformers for each party are shown on the hexmap below (and again, a traditional map is also available).

The Most _____ District
A variety of superlatives also pop out:
The closest district: That honor goes to Ohio's 13th, based in Akron and Canton, which went for Harris by just 183 votes, a difference of 0.046 percentage points. Democratic Rep. Emilia Sykes won reelection by a slightly wider 51-49 margin.
Note that the presidential results are not an estimate but rather an exact figure: For the two counties in the 13th split with other districts (Portage, which is mostly in the 14th, and Stark, which has a sizable chunk in the 6th), we obtained precise breakdowns of the presidential vote by congressional district from state officials.
The reddest district: For the second time in a row, it's Alabama's 4th in the north-central part of the state, represented by Republican Robert Aderholt. It voted for Trump by an imposing 83-16 spread, even wider than his 81-18 margin four years earlier.
The bluest district: This title has been reclaimed by Pennsylvania's 3rd, in the heart of Philadelphia. This seat, served by Democrat Dwight Evans, backed Harris 88-11. It was just barely the second-bluest in 2020, supporting Biden 90-9 according to the new district lines used in 2022. Under the old lines (which were very similar), it had been the bluest district in 2020 at 91-8 Biden.
The biggest overperformers: For Democrats, it was Ed Case in Hawaii's Honolulu-based 1st District. He defeated his GOP opponent 72-28, 19 points better than Harris' 62-37 margin. For Republicans, it was South Dakota's Dusty Johnson, who also won 72-28, 15 points ahead of Trump's 63-34 showing.
The biggest underperformers: On the Democratic side, Minnesota Rep. Ilhan Omar won reelection 74-25, 12 points behind Harris' 80-18 edge in the Minneapolis-area 5th District. And among Republicans, Alaska's Nick Begich narrowly unseated Democrat Mary Peltola 51-49, trailing Trump's 55-41 victory in the state by 11 points.
The median district: Arizona's 1st, in the Phoenix area, which supported Trump 51-48. By virtue of it being the median district, half of all seats are redder than Arizona's 1st on the presidential level, and half are bluer.
Since Trump won nationwide by 1.5 points, that means the median is to the right of the nation as a whole. Consequently, Republicans can win a majority in the House solely by winning districts that are more conservative than the country writ large.
Democrats, by contrast, would need to win at least seven districts that are redder than the U.S. as a whole to secure a majority. The median district, therefore, is one illustration of the way in which the national House map favors Republicans, due in key part to GOP gerrymandering.
Okay, Here's Something Cool
There's one last feature of our new release that we want to highlight. If you dig into our catalog of spreadsheets showing our calculations on a state-by-state basis, you'll see breakdowns for every county as well.
Michigan, which is home to several competitive House districts, offers a great example. In particular, it's worth zooming in on the swingy 7th District, which is based in the state capital of Lansing in solidly blue Ingham County but also includes a number of more conservative outlying areas.
Thanks to our calculations, we know the exact presidential vote for each of the seven counties in the district—four whole counties and three partial. Ingham, the main population center, voted 64-34 for Harris, but every other county supported Trump to varying degrees. That was enough to give him a narrow 50-49 win—and to propel Republican Tom Barrett to a 50-47 victory last year.
The district's dual nature is vividly illustrated in the map below.

Note that for the three counties split between districts—Eaton, Oakland, and Genesee—the figures above are only for the portions contained in the 7th District. Jumbo Oakland County, for instance, is divided between six different districts. To find out how each sub-part performed, just click through to our Michigan data.
Again, if you appreciate the work we've done to compile and calculate all of these results, we'd be deeply grateful if you'd become a paid subscriber.
A project of this size and scope would be impossible without the help of many hands. In particular, we owe a debt of gratitude to:
Derek Willis and OpenElections, for transforming ugly results into usable data
Ben Rosenblatt, for his immaculate collection of New York election returns
The Downballot community on Discord, for going the extra mile to gather results, especially Arjav, Jake, GoUBears, and SpeakerTip
Lastly, we must thank the godfather of this project, Jeff C., who first developed our approach to calculating these results in 2009. Jeff brought unmatched rigor to this effort, which guides us to this day, and he continues to provide us with his singular advice.
What stands out to me: Trump carried the median district by 1.6% more than he did the country as a whole. But Republicans won the median seat by only 1 point — or 1.7% less than they won the overall House vote.
That means House Democrats outperformed the presidential baseline in the tipping-point district by over 3 points. Had they merely matched it, they’d be ten seats (won by Republican candidates between 1.0% and 4.3%) short of where they are today — facing down a 230–205 GOP majority.
Did you find any signs of vote tampering? Was the election honest?