
The Downballot's calculations of presidential election results by congressional district, sponsored by Grassroots Analytics
Our one-of-a-kind collection spans from 2008 to the present
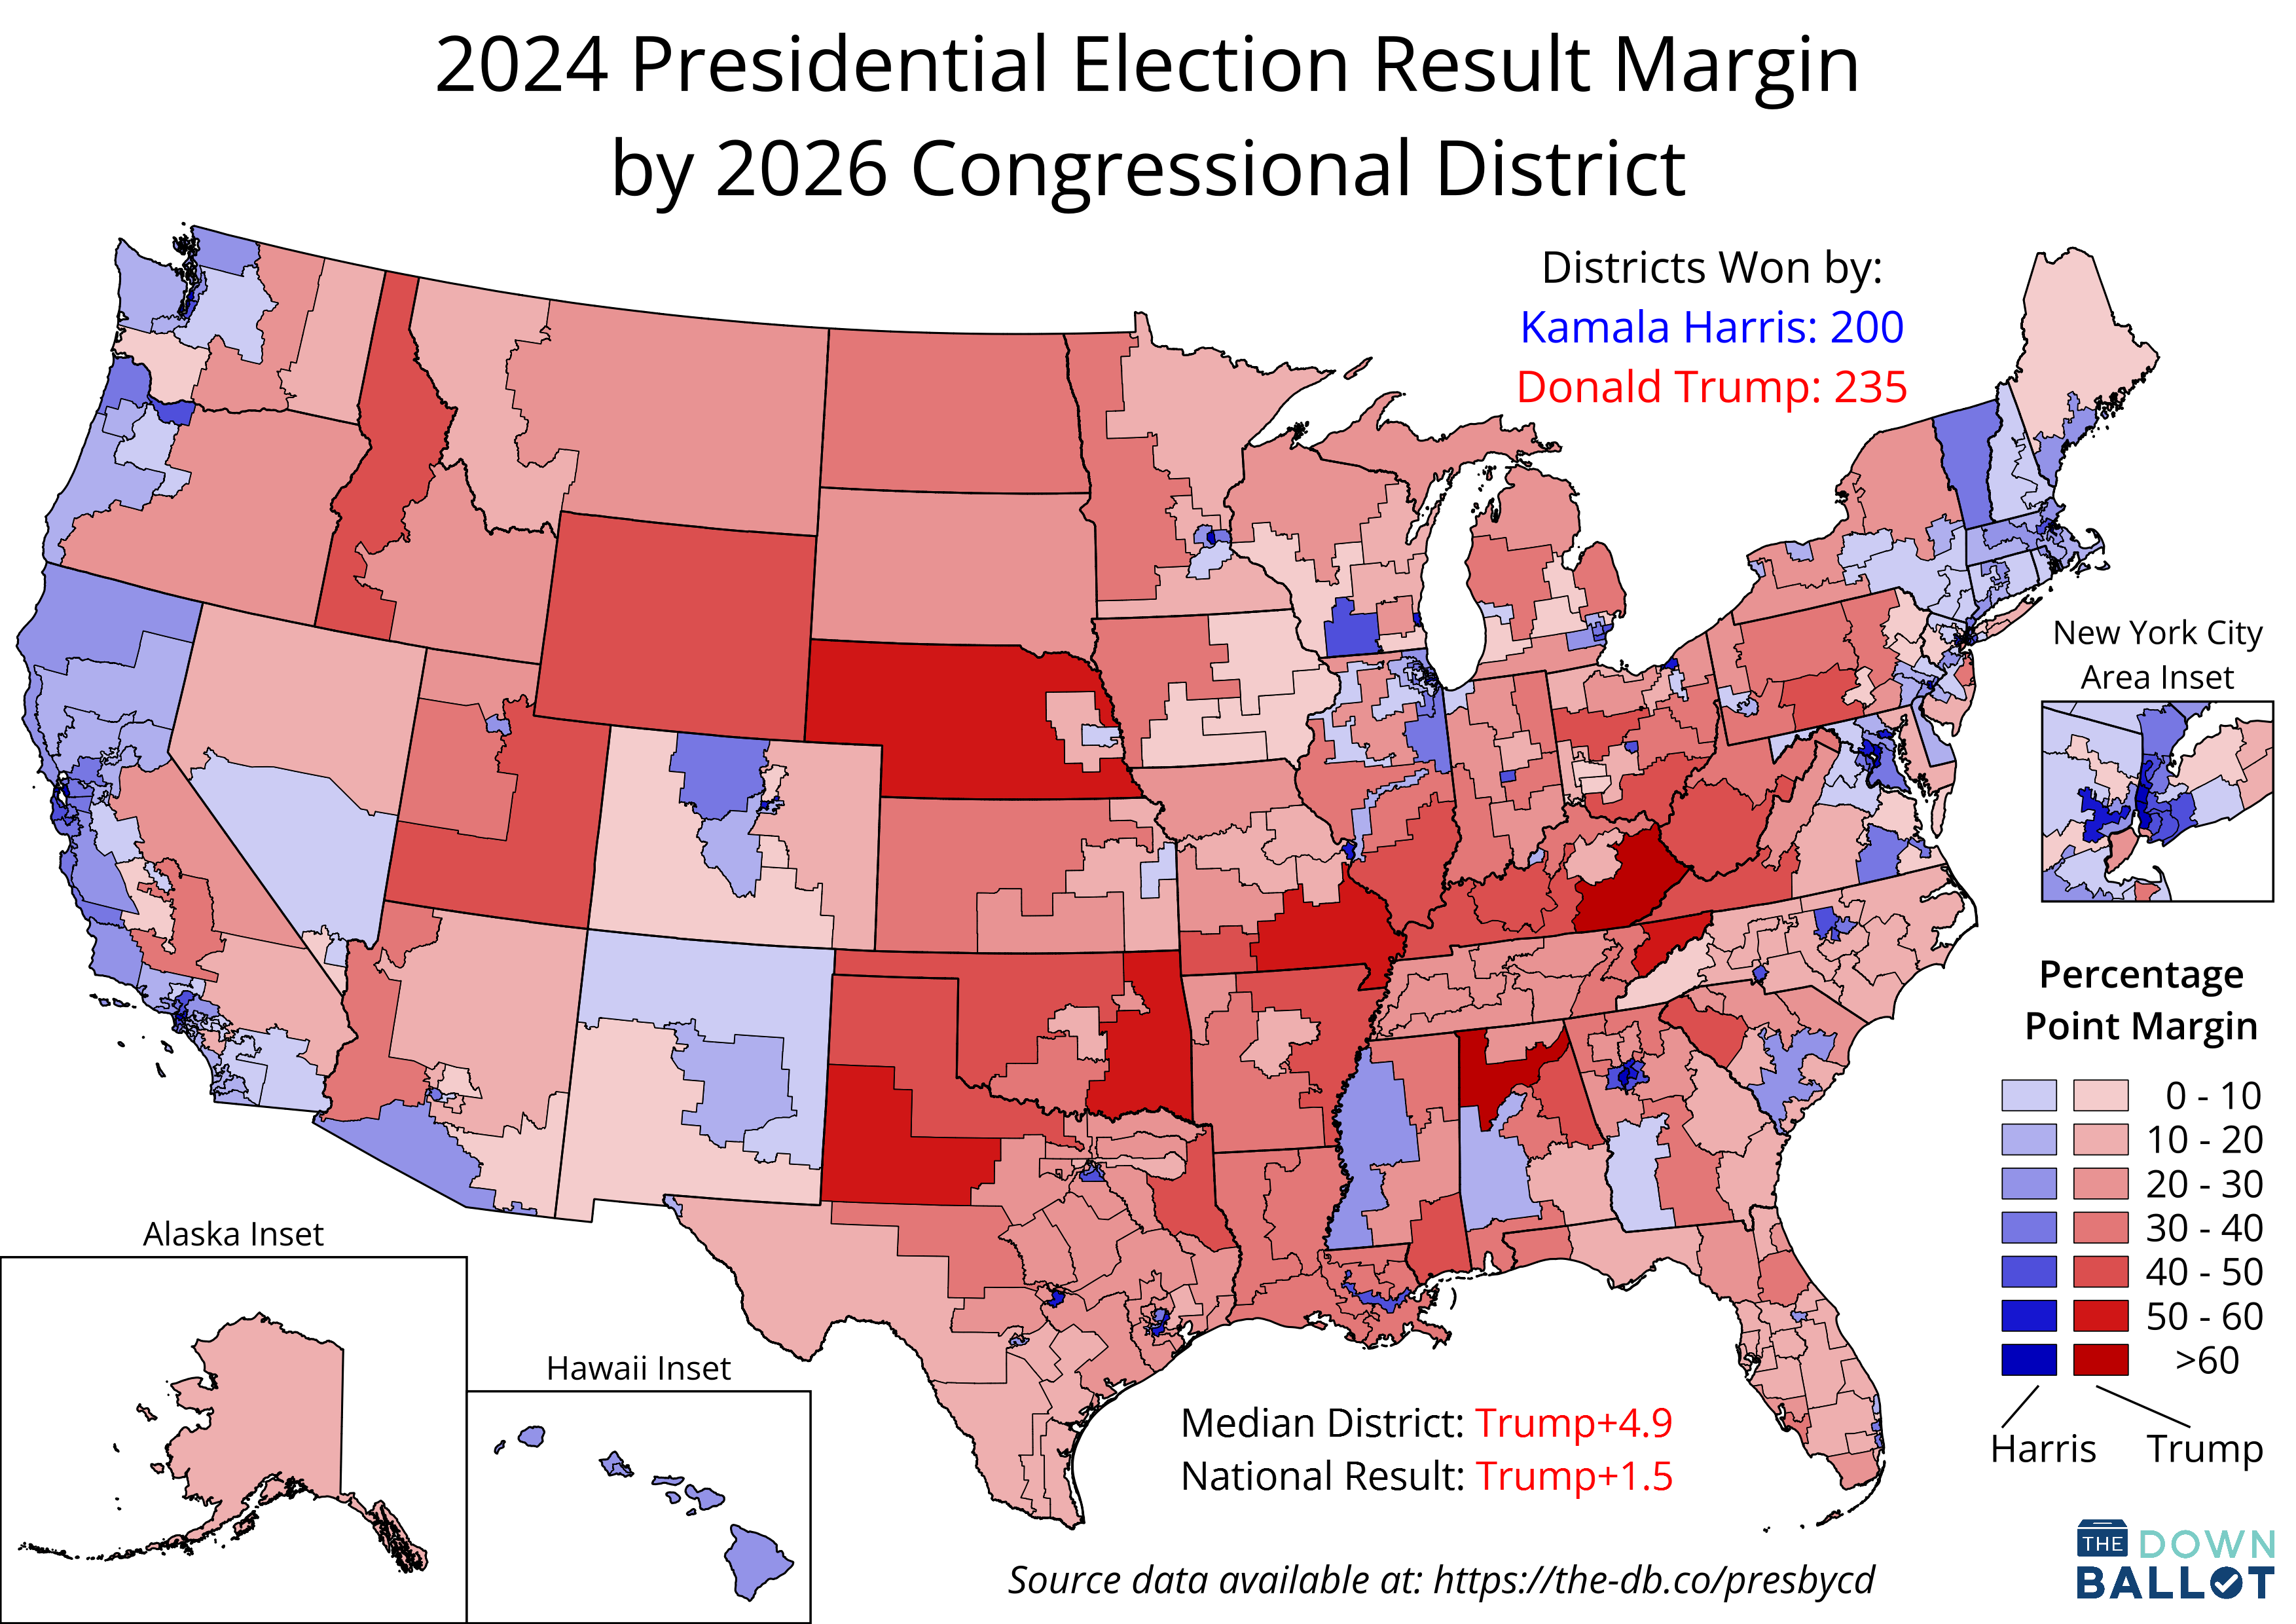
Below are The Downballot's calculations of the presidential election results for the 2024 and 2020 elections according to the congressional district lines used in 2024.
The results for 2024 are visualized in the cartogram at the top of this post, which shows each district equally sized (click here for a traditional map).
We've also published a detailed explanation of our process for calculating the 2024 results, as well as an examination of our key findings.
A message from our sponsor, Grassroots Analytics:
Grassroots Analytics builds fundraising tech that empowers candidates and nonprofits to win important fights.
At Grassroots Analytics, we strongly believe that running for office and creating social impact shouldn't depend on personal wealth or insider connections. Our mission is to provide innovative data solutions that dismantle the barriers to entering the political and nonprofit arenas while reimagining the fundraising practices of the past.
Where you get your data matters. Take a look at our game-changing services →
Links to data for earlier elections may be found beneath the table below.
Note: "Margin" reflects the Democratic vote share minus the Republican vote share.
If you haven't yet subscribed to our daily Morning Digest newsletter covering the thousands of elections below the presidency—where we make frequent use of this data—please do so today:
Click the link above reading "+ Show 375 more" to view the complete table.
You may also access the table above in spreadsheet format.
Historical Data
Data for earlier presidential elections may be found below:
2020 results according to the district lines used in 2022.
2008, 2012, 2016, and 2020 results according to the district lines used in 2020.
2008, 2012, and 2016 results according to the district lines used in 2018.
2008, 2012, and 2016 results according to the district lines used in 2016.
2008 and 2012 results according to the district lines used in 2012 and 2014.
2008 results according to the district lines used in 2012.
2008 results according to the district lines used in 2006, 2008, and 2010.
Data comparing presidential results for the districts used both before and after decennial redistricting may be found below:
2020 results according to the district lines used in 2020 and 2022.
2008 results according to the district lines used in 2010 and 2012.
Note that these calculations do not include write-in candidates except in rare cases where write-in tallies were unusually high.
For a complete statement of the methodology used to calculate these results, as well as links to the raw election data underlying them, click here.
For access to our detailed county-level calculations, check out our complete data collection.
OMG there are actually two districts bluer than mine? (Lateefah Simon/Barbara Lee). I'm impressed! My eyes might have glazed over and skipped a number here and there... Thanks for these numbers, guys!
Yikes, I see only 19 districts where Harris did any better than Biden.