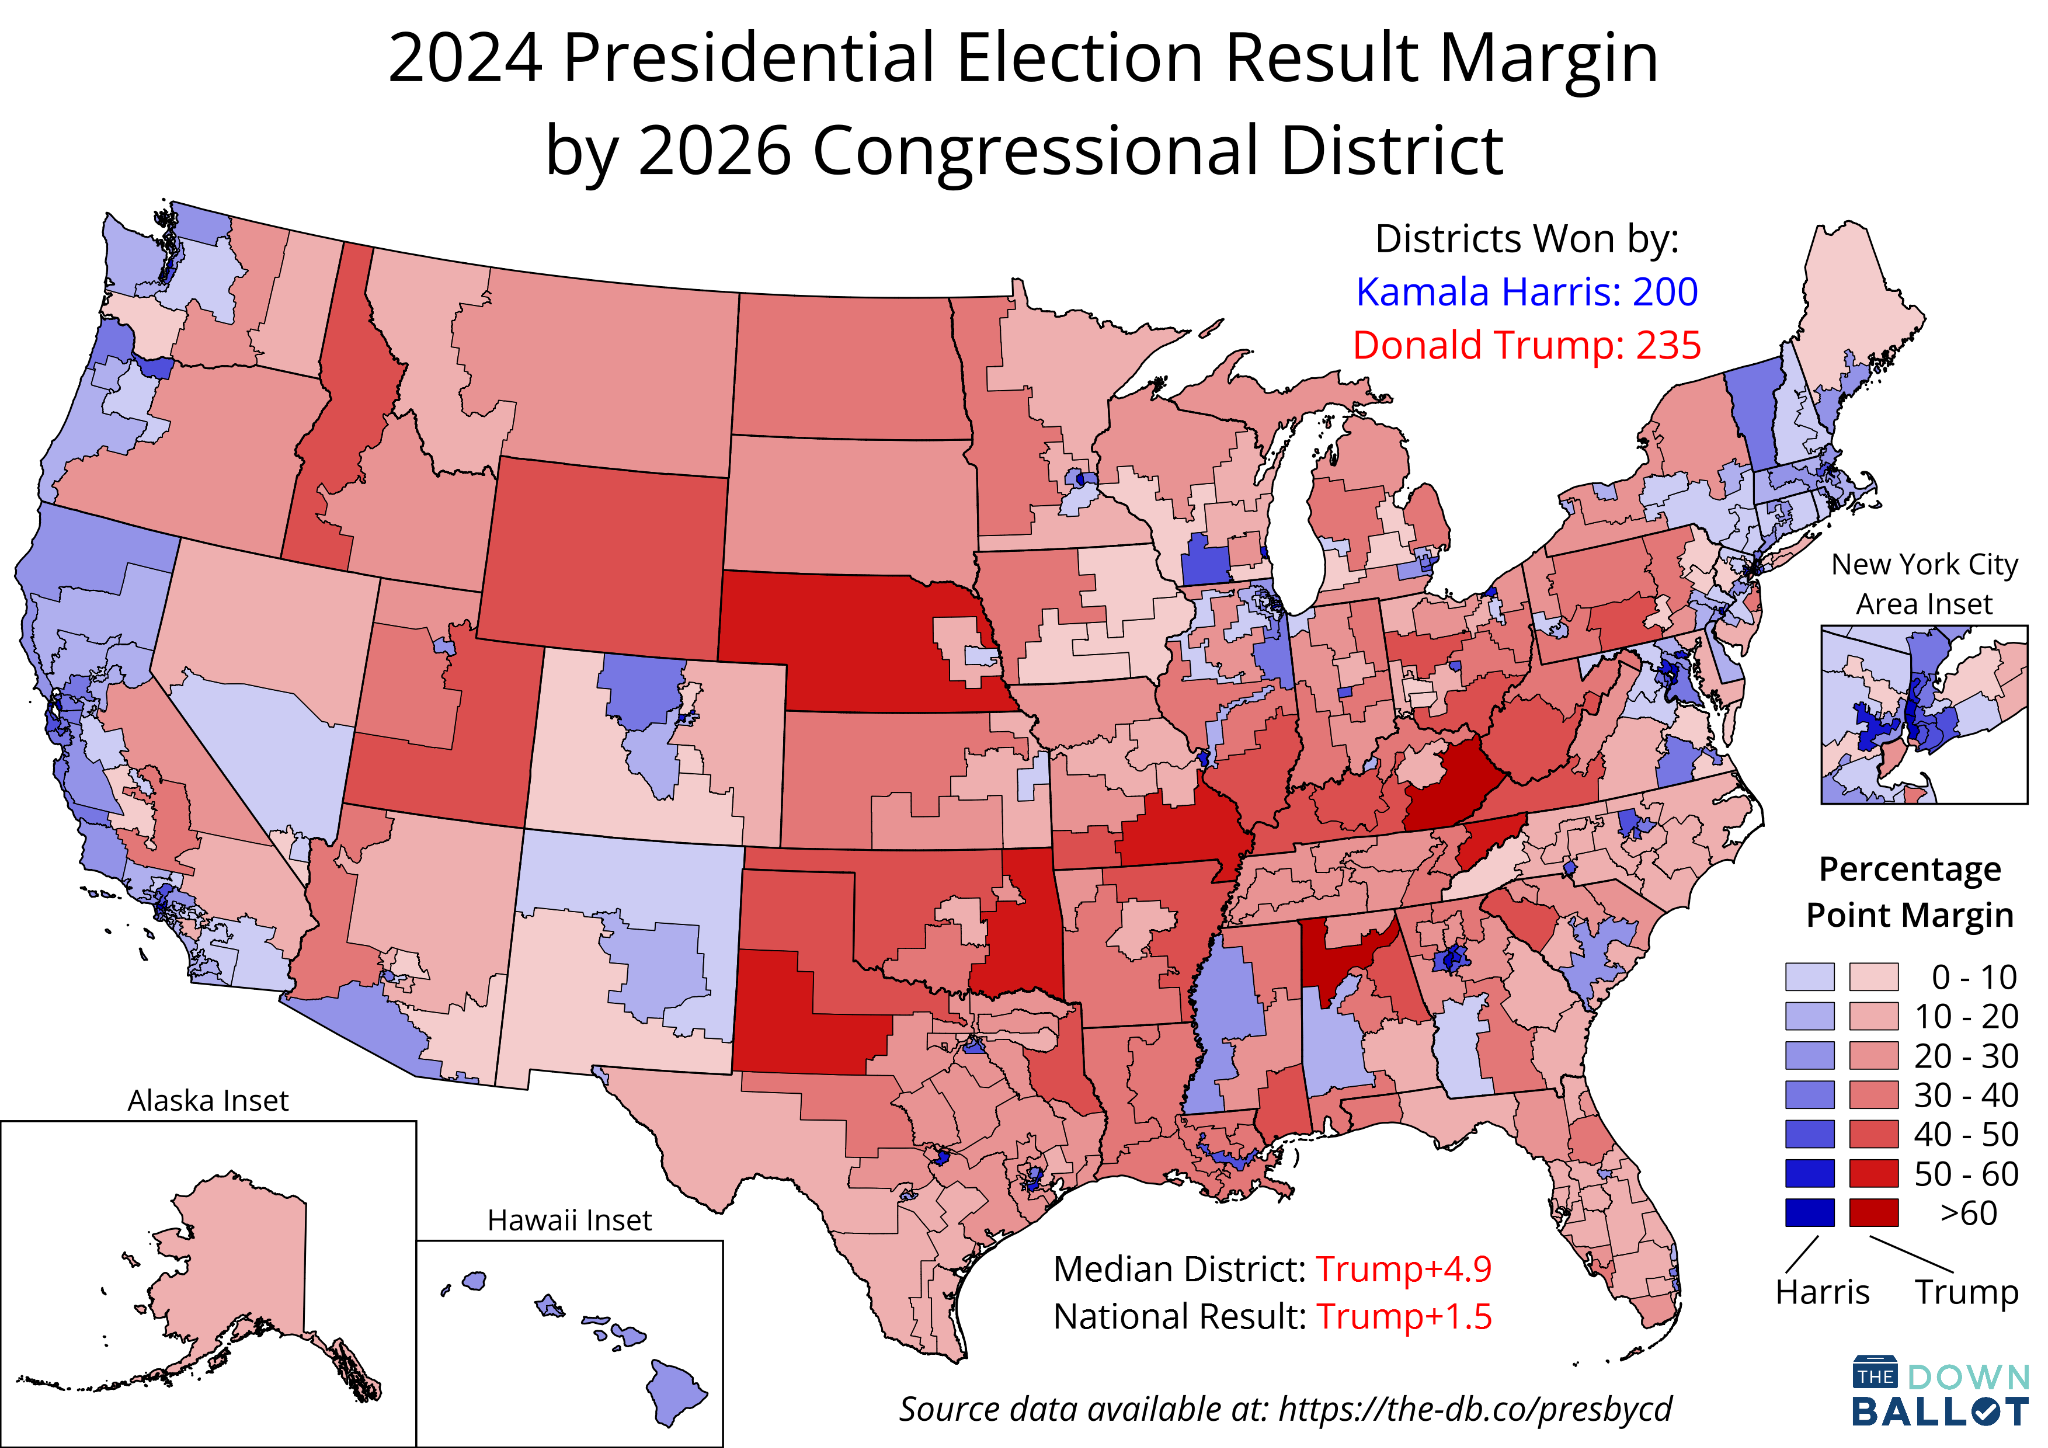
The Downballot is pleased to present our calculations of the results of the 2024 presidential election for every congressional district that will be used in the 2026 midterms—including updated data for all 10 states with new maps.
Grassroots Analytics is teaming up with the Higher Ground Institute to host a campaign simulation in Washington, DC this August!
Join us on August 24th and 25th as we shrink an entire primary campaign down to two days to take big swings, try new ideas, and experiment with the possibilities for progressive campaigning. Anyone who is part of the campaigns and election space is welcome to attend. Registration and your hotel stay come at no cost to you!
The Downballot’s calculations, which we’ve provided to the public since the 2008 elections, represent the gold standard when it comes to presidential results by district because of our commitment to accuracy and transparency.
It’s been adopted so broadly because we provide much more than just the topline figures. We also:
Show our work by publishing detailed spreadsheets that include all of our calculations, including breakdowns for each county and partial county that make up each district.
If you value all our hard work in compiling this data—and especially if you plan to use it for your work—we’d be incredibly grateful if you’d become a paid subscriber.
The number of states requiring new calculations in the middle of a decade is exceptionally high, particularly since all but one new map was enacted voluntarily, rather than as the result of a court order. By contrast, just four states saw mid-decade redistricting in the entirety of the 2010s, all because of litigation.
The turmoil stems from the directive Donald Trump issued just over a year ago to Republican-controlled states, demanding that they further gerrymander their maps to insulate the GOP from voters amid an unfavorable political environment.
Trump’s push began with Texas, but soon enough, Missouri and North Carolina followed suit. And after the Supreme Court gutted what remained of the Voting Rights Act in April, Southern states swiftly began dismantling districts where Black and Latino voters had previously been guaranteed the opportunity to elect their preferred candidates. These included Alabama, Florida, Louisiana, and Tennessee.
Ohio was also obligated to pass a new map thanks to a baroque set of rules adopted under the misleading guise of redistricting reform. Republicans could have re-passed the state’s existing map but instead used the opportunity to placate Trump as well.
Only California Democrats were able to fight back, as a mix of state laws, unfavorable court rulings, and political complacency resulted in no changes in any other blue states. Utah, finally, will have a new map that’s more favorable to Democrats after a court ruled the previous GOP-authored map violated a voter-approved measure curtailing partisan gerrymandering.
In all, these 10 states—which include the three largest—cover 181 districts, though 36 were left unaltered. The 145 districts that did change amount to exactly one-third of the seats in the entire U.S. House of Representatives.
What it means for November—and beyond
The new maps have already led to serious disruption, as many incumbents have retired or lost primaries as a consequence, or are running in different districts. The greatest effects, though, will be felt in the November general elections.
In all, Republicans have targeted 16 seats by making them redder, while Democrats have done the same for just five seats, and the court ruling in Utah adds a sixth. The presidential results for these districts, along with their predecessors, are shown below, demonstrating just how much each of these districts has changed politically.
These transformations have, just as Trump had hoped, made it harder for Democrats to win back control of the House this fall. The simplest and clearest way we can measure this shift is by zooming in on what’s known as the median district.
We can find this district by ranking every seat from bluest to reddest, based on its performance in the 2024 presidential election. The district in the very middle—the median—gives us a sense of the kind of turf either party would need to win to capture a bare majority of 218 districts.
Before Trump launched his redistricting crusade, the median district, Arizona’s 1st, already leaned to the right of the nation as a whole: Trump won it by 3.1 points in 2024, even though he won the national popular vote by 1.5 points.
Now the median district is Virginia’s 1st, which went for Trump by 4.9 points—1.8 points further to the right than it was two years ago, and 3.4 points to the right of the country.
That means Republicans could retain their House majority by winning only districts that Trump won by around 5 points or more—and none bluer, including any won by Kamala Harris. Democrats, by contrast, would need to win at least 18 districts carried by Trump.
Winning on the other side’s turf
House elections never sort out that neatly, though, because some Democrats inevitably win red districts—even those redder than the median—while some Republicans will win blue ones.
These “crossover” districts have declined dramatically as ticket-splitting has grown increasingly rare in American politics. That is to say, the vast majority of voters who cast ballots for a Democratic presidential nominee will also vote for a Democrat for the House, and vice versa.
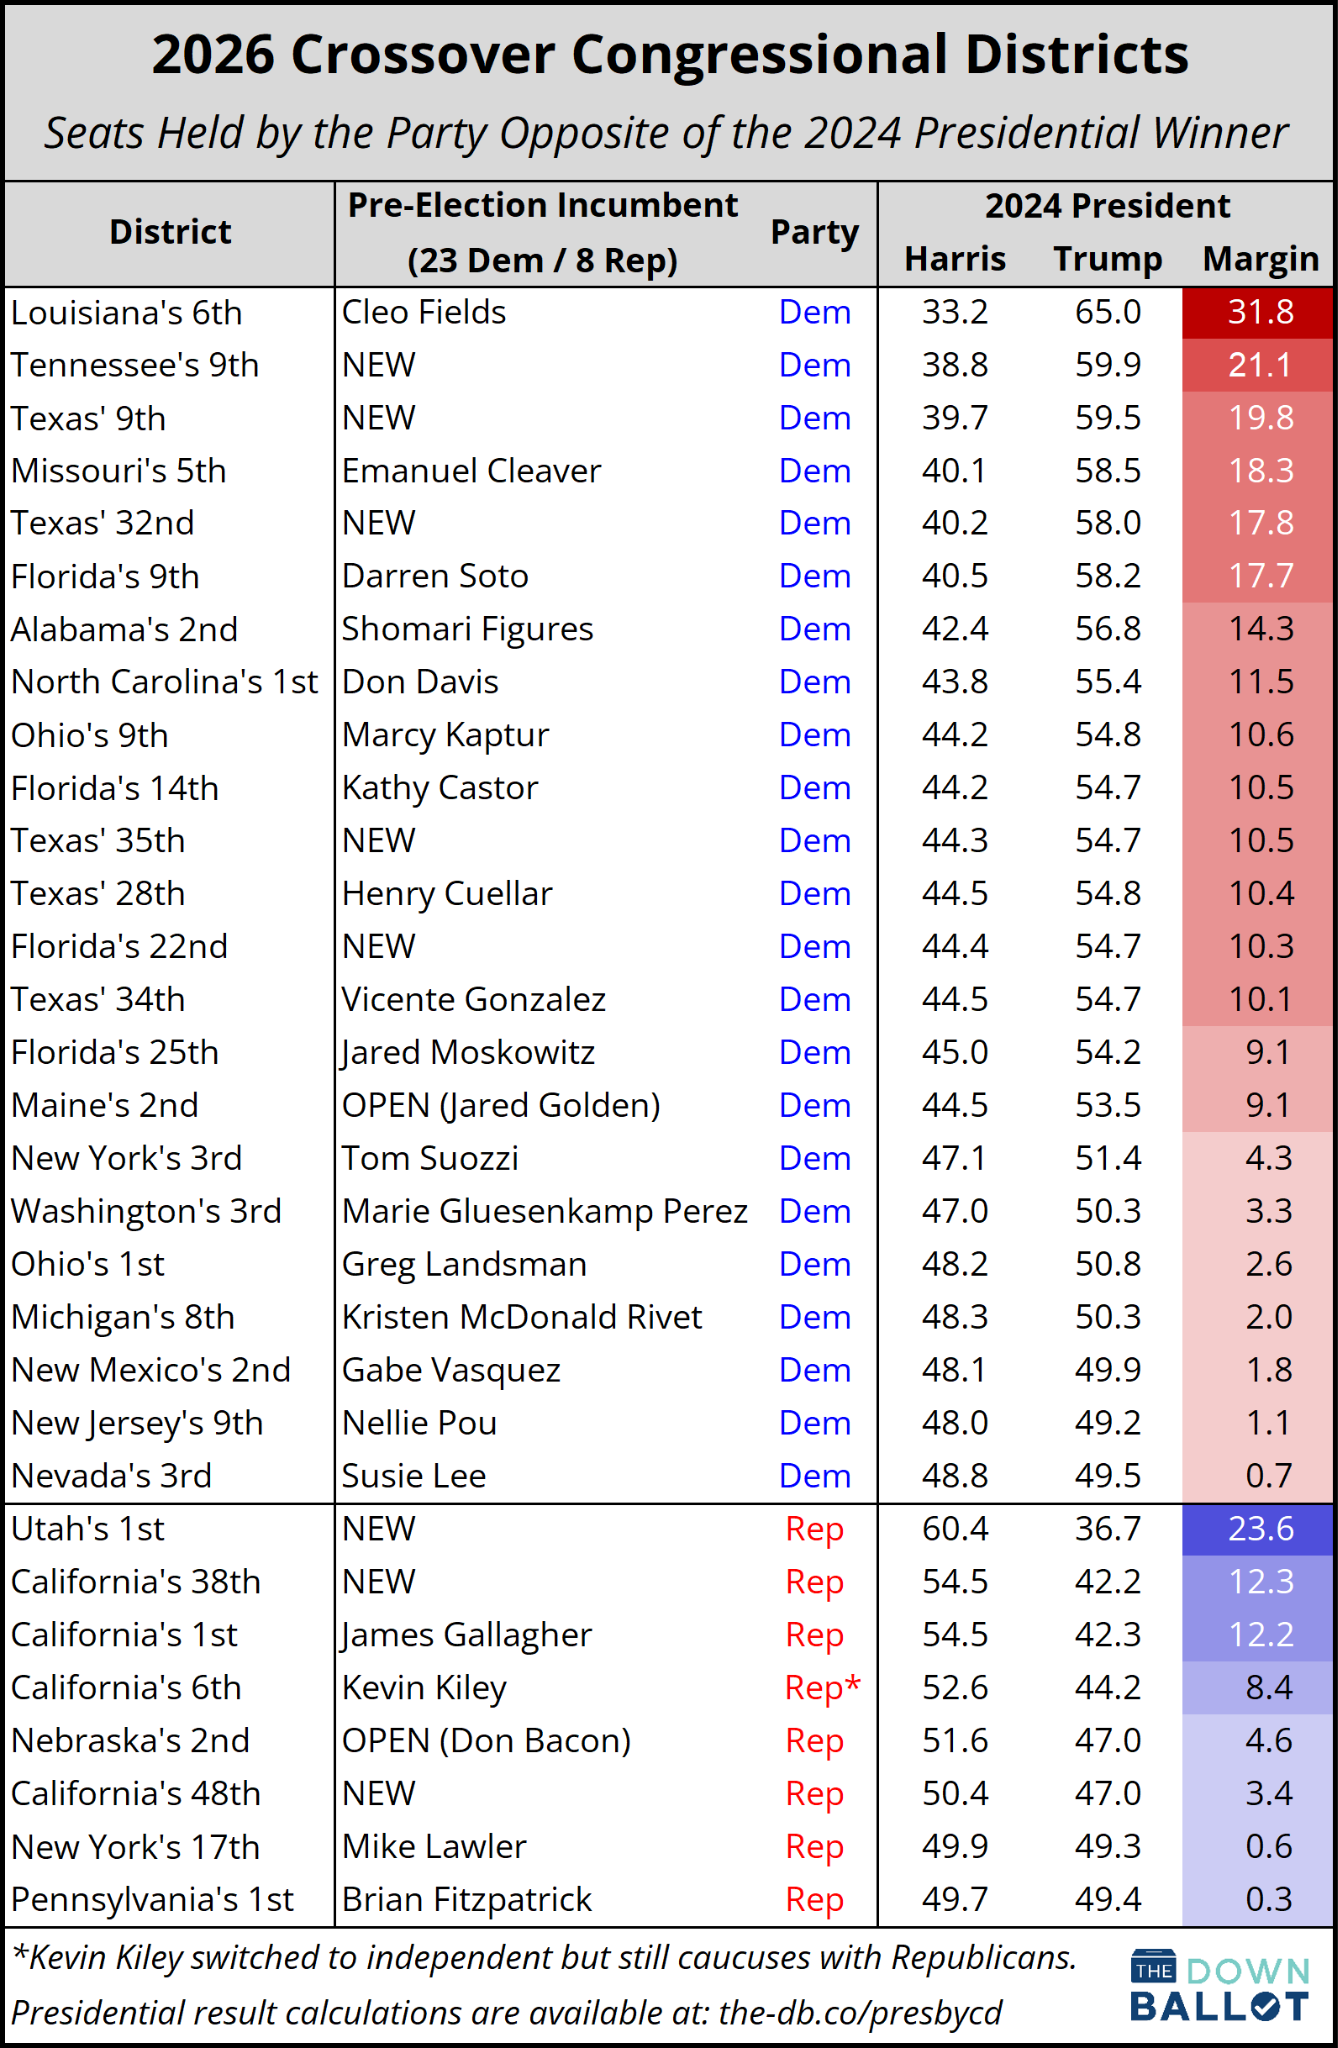
In total, there were just 16 crossover districts in 2024: three “Harris-Republican” seats and 13 “Trump-Democratic” seats. Thanks to the new maps, though, these numbers have spiked, as you can see in the table below, with eight Harris-Republican seats and 23 Trump-Democratic seats.
In states with new districts where no incumbent is running, we’ve labeled those seats as “NEW” and assigned them to the party that previously held them. As you can see, many incumbents chose not to run again (or ran elsewhere) rather than seek reelection on hostile turf.
Some, however, are fighting on despite facing more difficult odds, such as Democrats Darren Soto, Shomari Figures, and Emanuel Cleaver, and Republicans James Gallagher and Kevin Kiley. (Kiley changed his party affiliation to independent earlier this year but is still a member of the GOP caucus and is running with Republican support.)
Not all targets are created equal
Yet even though Republicans have—for now—won the battle over redistricting, they are still more likely than not to lose the war for the thing that matters most: control of the House.
Democrats currently enjoy a 6-point lead in an average of generic congressional ballot polling compiled by FiftyPlusOne, and the site’s new simulation of what would happen if the midterms were held today shows Democrats would win at least 218 seats approximately 88% of the time. Historically, these numbers are only likely to improve for the party out of power as we get closer to Election Day.
That’s why it’s important not to conflate the number of seats each party has targeted in redistricting with the number it’s apt to flip—especially in red states.
Texas Republicans, for instance, overhauled five Democratic-held districts, but Democrats are still fiercely competing for three of them, so it wouldn’t be a surprise if the GOP came up well short of their goals in the Lone Star State.
The same is true for many impacted races in Florida, North Carolina, Ohio, and Alabama, while in Missouri, a ballot measure may yet succeed in blocking the state’s new map from taking effect.
What’s more, even though presidential elections are very strongly correlated with House elections—as the very small number of crossover seats indicates—they are a starting point, not an ending point, for anyone interested in understanding how November will unfold.
It bears emphasizing that Trump’s 2024 performance may, in many districts, represent something of a high-water mark for the GOP. Much has changed since then, including Trump’s nosediving popularity; deep discontent over the soaring cost of living; and boomeranging attitudes toward Republicans among many Latino voters, who veered sharply to the right two years ago but have since swung back to the left just as strongly.
That last point is particularly crucial for several of the districts that the GOP targeted that are still home to large numbers of Latinos, many in Texas and Florida. In such cases, the electorate may wind up more closely resembling 2020’s, when Joe Biden performed far better with Latinos than Kamala Harris did four years later.
Texas’ 28th, where Latinos make up 87% of the eligible voter population, offers a particularly vivid example. The new version would have voted for Trump by a 55-44 margin, but according to data from the Redistricting Data Hub and Dave’s Redistricting App, Biden would have carried it 54-45.
In the end, Republicans are all but certain to flip fewer seats than the 16 they targeted—perhaps only around half, and in the very best-case scenario for Democrats, as few as four. Democrats, by contrast, are likely to pick up all of the California districts they redrew, as well as the seat in Utah.
And above all else, this limited set of districts does not represent the entire House battlefield—far from it. Scores of races will be in play this fall, perhaps as many as 100. It’s for that reason that Trump’s plan to keep his lock on power through gerrymandering is so unlikely to succeed.
Again, if you appreciate the work we’ve done to compile and calculate all of these results, we’d be deeply grateful if you’d become a paid subscriber.




Fantastic work. Thanks for this.
Thank you!