


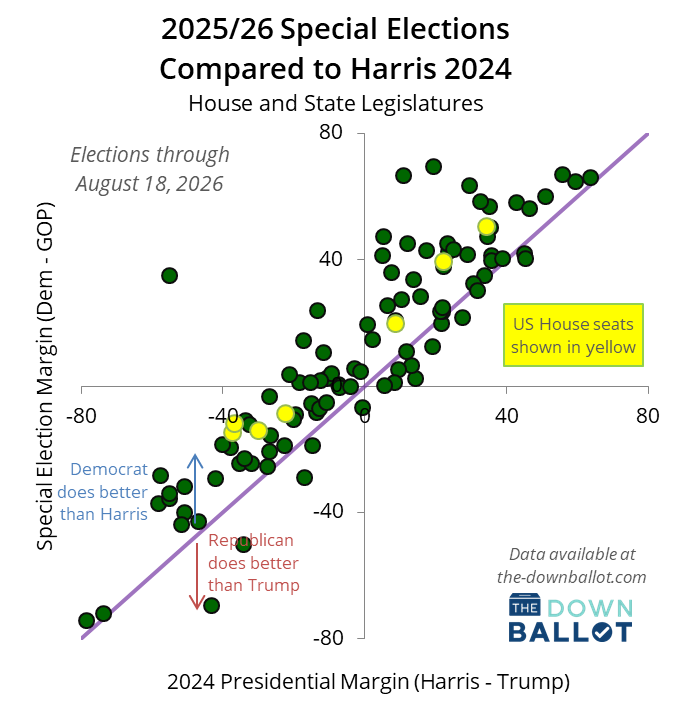
The final legislative special election before November brought the cycle to a close in dramatic fashion on Tuesday, with Democrat Brandon Dukes flipping Pennsylvania’s 12th House District while overperforming Kamala Harris’ margin in the district by 19 points.
It was also the 31st legislative flip of the cycle, all of them won by Democrats. The overall results since Donald Trump’s return to the White House show strong, consistent overperformance for Democrats similar to what we saw in 2018.
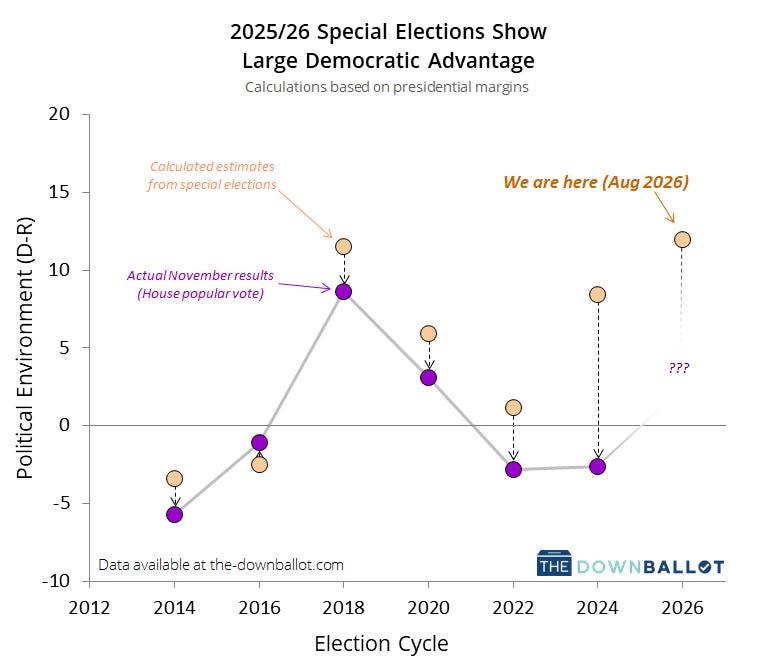
Across 110 special elections since January of 2025, Democrats have, on average, overperformed Harris by 12.5 points and Joe Biden by 8.4 points. Together, these figures suggest a calculated political environment in which Democrats would be favored by 12 points—slightly better, even, than what the same data was telling us in 2018.
However, the actual popular vote for the U.S. House eight years ago fell a few points shy of that mark. Indeed, the calculated political environment has exceeded the House popular vote in every cycle since 2018, as seen in the chart at the top of this piece.
One likely reason for this gap is the educational polarization of the electorate in the Trump era. Put simply, more highly educated voters—who are more likely to vote in special elections—have a much dimmer view of Trump and his Republican Party than less educated voters. This would mean that the typical electorate for special elections is consistently more Democratic-leaning than the electorate at large.

Special elections can also err in estimating the lean of the political environment if the environment changes mid-cycle. This happened in 2022 after the Supreme Court overturned Roe v. Wade, and again in 2024, when there was a sharp difference in special election results before and after November of 2023.

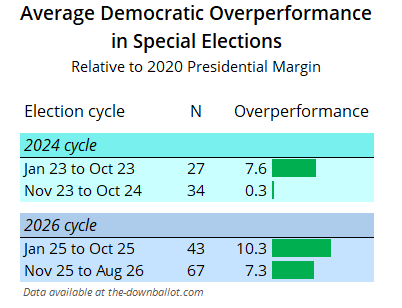
However, we haven’t observed any comparable shifts this cycle. In fact, the calculated political environment has been remarkably steady throughout, as shown in the green line below.
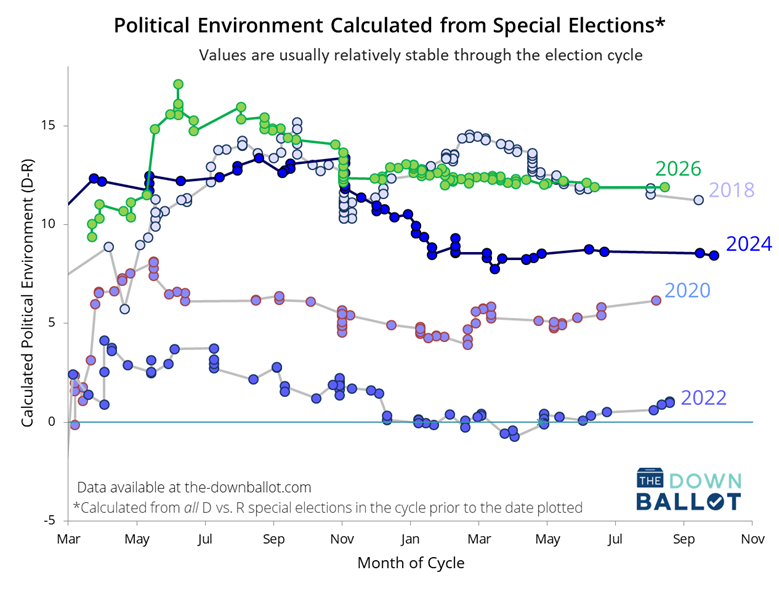
The chart above shows the political environment calculated from special elections throughout the cycle, including all elections prior to the date plotted. Earlier in the cycle, the line often moves as there haven’t been many elections, meaning one outlier can move the average a fair amount. By the middle of the cycle, however, it takes real movement to change the line, as in 2024. The 2026 cycle shows some change from the first to second years of the cycle but is overall fairly stable.
Not only has the calculated environment been very steady, but the distribution of overperformances has also been surprisingly tight. All federal special elections (seven in total) fell within a 15-point band, while the state special elections were tightly clustered, too.
In fact, the distribution of overperformances produces a very neat and tidy pattern, possibly due to the nationalization of local politics in recent years, as the histogram below shows:
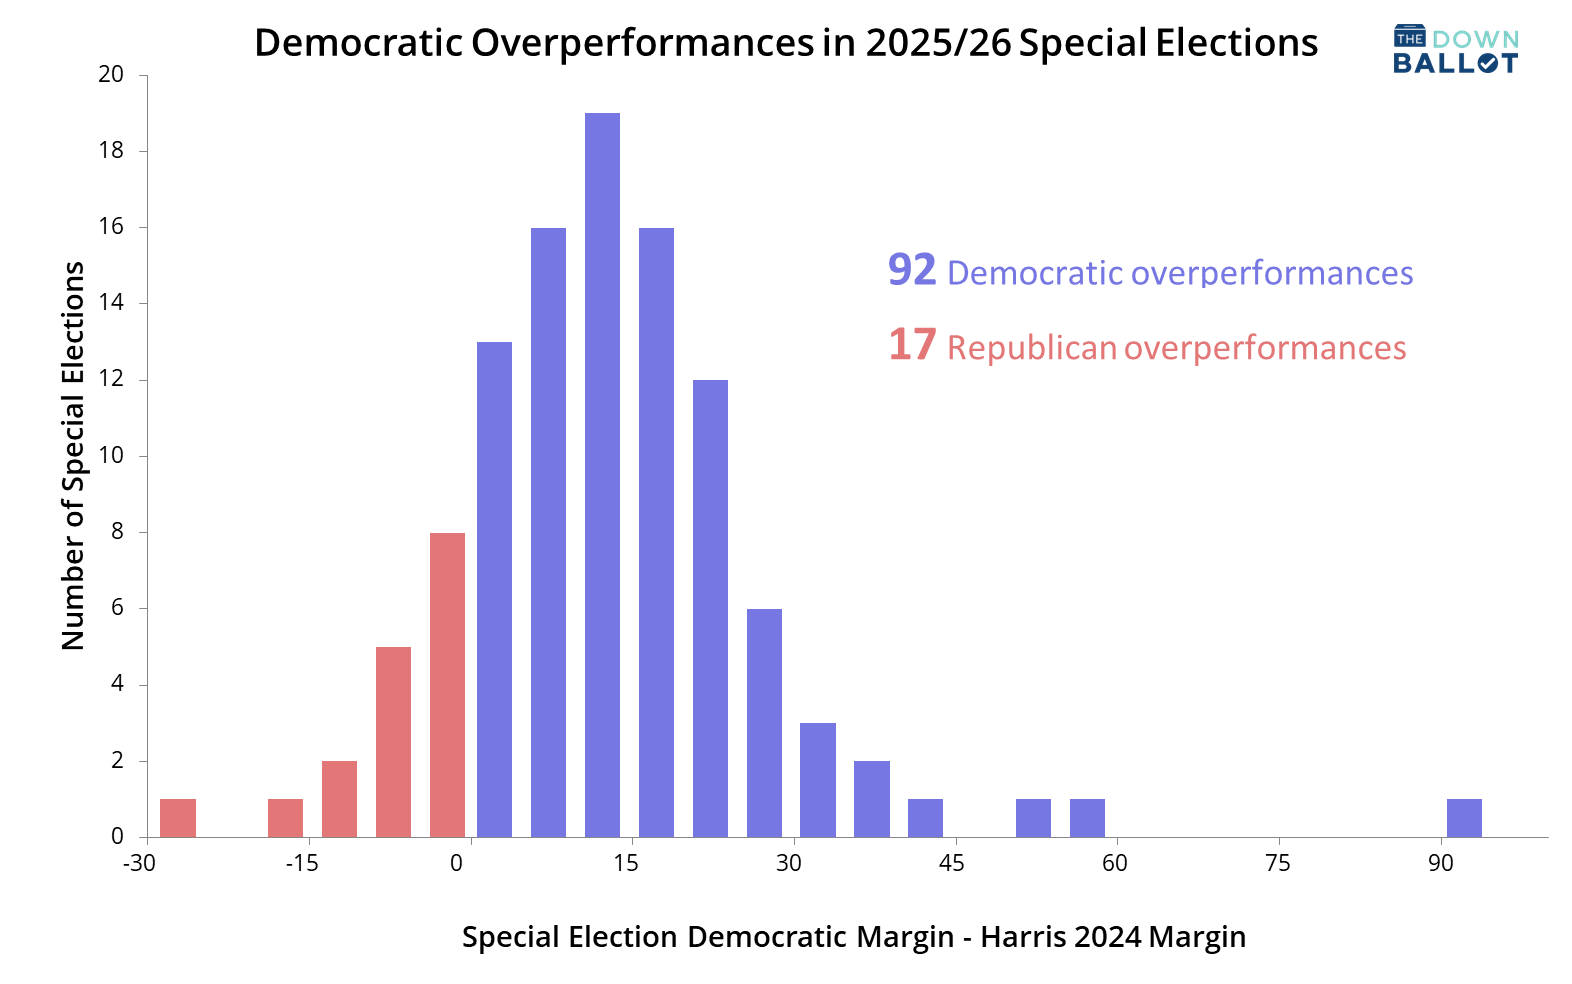
(That 90-point overperformance outlier this cycle, in case you’re wondering, was a New York Senate special election in the 22nd district with a large Orthodox Jewish community that tends to vote as a bloc; in this particular election, community leaders endorsed the Democrat.)
Compare the 2026 distribution of overperformances to the data from 2018:
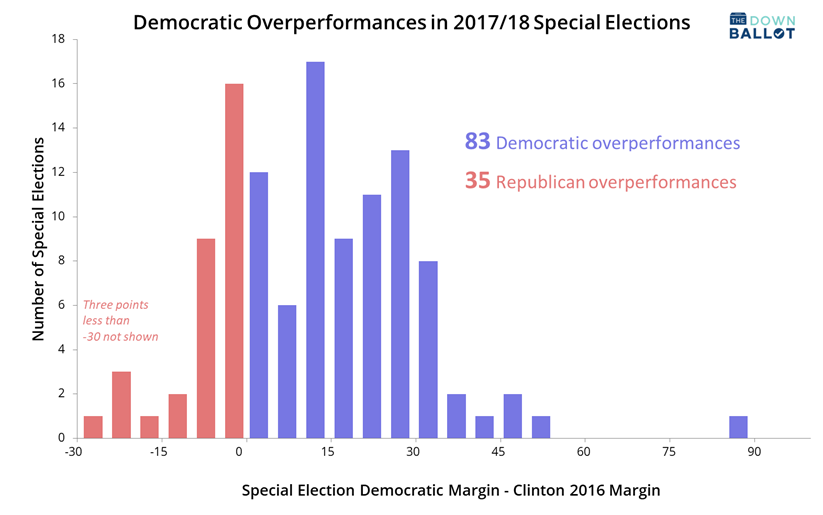
This time we don’t see such a well-behaved curve. This may reflect genuine shifts in the political environment in the 2018 cycle, skewing the pattern.
So what does this all mean?
Based on the special election results, we would expect a political environment similar to what we saw in 2018. Educational polarization has likely increased somewhat since then, so we might see a slightly bigger gap between the special election estimate and the actual result.
On the other hand, Trump’s disapproval numbers are falling even among Republicans, something that was not the case in 2018; if Trump voters are demoralized enough, they might stay home in greater numbers than in the past, yielding a more Democratic electorate.
Also, in the 2026 cycle, we’re seeing Trump’s approval numbers continue to decline through the spring and summer of election year, when there have been few special elections to gauge the mood of the electorate. And that brings us to the biggest wild card of all: what Trump himself might do between now and Election Day.
Even if little changes, though, the special election data shows that Democrats remain in a strong position to reclaim the House in November.
Does this analysis suggest anything about how the Senate elections may go?
Have you guys tested whether later results (say the year before the general) produce more reliable predictions?