



As spring turned to summer in 2022, keen political observers were quick to take note of a new development. After a desultory election cycle that saw Democrats consistently underperform in special elections, the party turned in five impressive showings in a row, all in congressional races.
They included a couple of near-misses in Republican districts, a successful defense on difficult turf in upstate New York, and, most impressive of all, a flip in deep-red Alaska.
What changed? It wasn’t hard to see. On June 24 of that year, the Supreme Court handed down its decision in Dobbs v. Jackson Women’s Health Organization, a seismic ruling that overturned the right to an abortion established almost half a century earlier in Roe v. Wade.
Virtually overnight, the political landscape had shifted, and the special elections were our first proof. What had looked like a grim midterm election for Democrats wound up a draw, if not better, and Dobbs was instrumental in that change in fortunes. If you’d been keeping an eye on the special elections, the November outcome suddenly made a lot more sense.
Over the last decade, thanks to The Downballot’s pioneering work, special elections have emerged as a critical tool for assessing which way the electoral winds are blowing.
And just like the weather, special elections vary a great deal while still having an underlying pattern. Just as with climate change, a single major storm means little, but a sustained shift can tell you something powerful.
We are looking for both shifts and their underlying causes. Occasionally, both are detectable by keen observers, as we saw in 2022. But more often, they can be much more difficult, if not impossible, to discern—at least, by the naked eye.
With a little help from some statistical tools, however, we can uncover the patterns that animate special elections. It turns out, these elections are much more than just an ongoing referendum on who’s in power. Rather, they reflect how voters respond to events more broadly.
Most important of all, with our statistical toolkit, we can determine when new events have begun impacting the electorate. Identifying these moments may allow us to figure out what’s driving voters—and when the competitive landscape has changed.
Thanks to The Downballot’s rich data tracking special elections over the last decade, we can identify seven distinct moments that marked pivot points in the political landscape. Armed with this information, we can now be on the lookout for similar inflections that are lurking just over the horizon.
This piece by independent analyst Marsha Kessler was possible because, for more than 20 years, The Downballot has made almost everything we’ve produced paywall-free. If you appreciate Marsha’s insights and our commitment to open-source data, we hope you’ll consider upgrading to a paid subscription to support our work.
How much overperformance is “a lot”?
Before we can uncover these pivot points, we have to address a preliminary question: When does a special election yield a result that’s sufficiently unusual for us to take notice? Fortunately, we have a rich set of data at our disposal that offers an illuminating answer.
Since 2017, The Downballot has compared the margin of victory or defeat in each special election for both the U.S. House and state legislatures with the result of the most recent presidential election in the same district. If a Democrat’s margin is better than the presidential margin, they’ve “overperformed.”
In March, Pennsylvania held a special election for the 79th District in its state House. Donald Trump had beaten Kamala Harris there 66-33—a 33-point margin—in 2024, but in the special election, Republican Andrea Verbosh defeated Democrat Caleb McCoy 56-44—a difference of only 12 points.
Though McCoy fell short of flipping the district, he outperformed the presidential baseline by 21 points, losing by only 12 instead of 33. Was that “a lot”? Individual special election overperformances like these are often cited as evidence that something remarkable is happening. But how do we know if this was an unusual event?
We can start by looking at the distribution of over- and underperformances by Democrats in 438 qualifying special elections tracked by The Downballot over the last decade. We’ve divided them into two buckets depending on which party held the White House, since we know that’s always a major factor, and graphed them below.
The figure shows the absolute extremes (”MIN” and “MAX”) along a vertical gray line, with the median marked by a yellow dot. Just above and below are black marks that indicate where the top and bottom quarter of all elections have fallen.
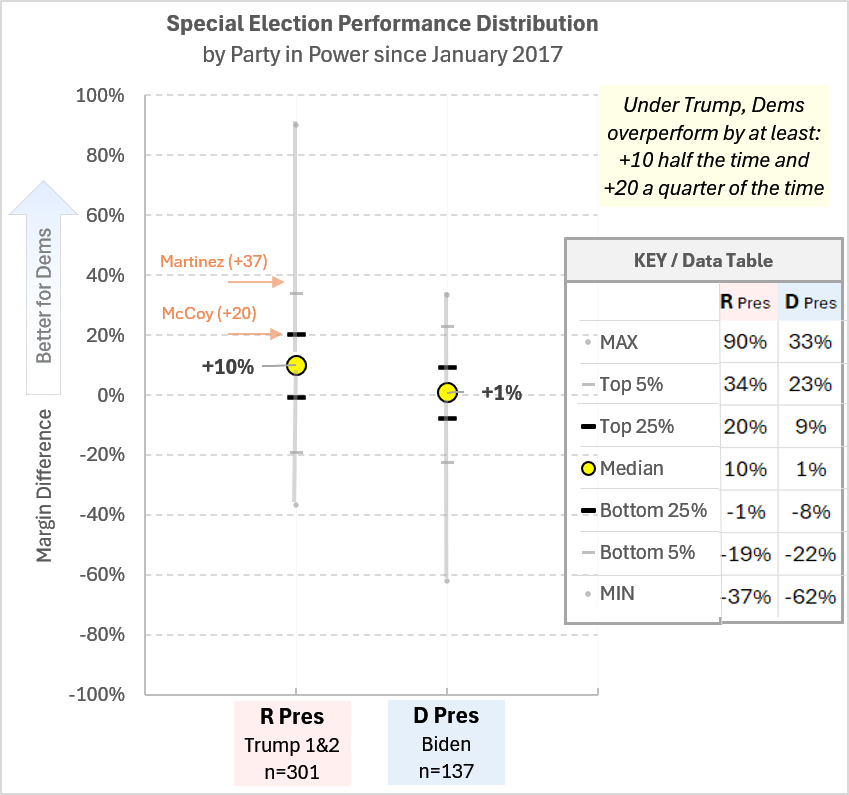
When Trump has been in office, that top quartile starts at a 20-point overperformance—very close to what we saw from McCoy in Pennsylvania earlier this year. It was an impressive showing, but the graph shows it was not an unusual one. In fact, we’ve seen overperformances of 20 points or more 77 times under Trump.
If we want to identify something unusual, we have to look further out.
To determine how extreme a single event is, one simple approach statisticians take is to count up how often events at least that extreme show up in the data. Analysts will typically look more closely at the top 5% of all occurrences—a 1-in-20 event—as such unusual occurrences may indicate something unexpected has happened that’s worth further investigation.
For an occurrence that rare, we’re talking about overperformances of 34 points or greater during Trump terms.
We saw just that happen in February, for instance, when Louisiana Democrat Chasity Martinez successfully defended a conservative seat in the state House. Martinez won a 56-43 landslide in a district Trump had carried 62-38, for an overperformance of 37 points—firmly in “unusual” territory.
So by just segmenting the data in a meaningful way and analyzing its distribution, we can tell a lot about whether an individual special election is unusual or not. Now let’s take this one step deeper.
The voice of special elections
In a coherent population—in our case, of special elections—unusual results happen at a predictable rate. The distribution analysis above gives us a quick glimpse into whether an individual election qualifies as unusual. Is this an everyday rain shower or a once-in-a-decade blizzard?
This is essential context every time we look at a single election. But an individual race can’t tell us whether the storm was a one-time fluke (something to ignore) or an indication of the whole population of elections shifting (something to pay attention to).
What we really want to know is whether and when things are changing. That is, are Democrats performing better or worse than they were before, as we saw after Dobbs? If so, why? To see if things are changing, we need to look at the data over time.
Special elections happen frequently—40 times a year on average, across much of the nation. That makes them a useful bellwether, but only if we know how to read them. We need to be able to distinguish signal (that is, true change) from noise (in other words, isolated events).
To do this, we’ve borrowed some statistical tools developed for process management, a field with roots in manufacturing, where it’s essential to know quickly if your process drifts out of spec so you can catch it and respond in real time.
We need to do the same here—find out when the political environment has changed as quickly as we can, not six months or a year later. (We explain our methodology in greater detail at the end of this piece.)
First, we’ve plotted qualifying special elections over time in a chart that displays data in event order, an essential first step in identifying statistically significant change. This type of graphic is known as a “run chart,” but all it does is show each special election, from January 2017 to the present, as a single dot, with overperformance (or underperformance) on the y-axis and date on the x-axis.1
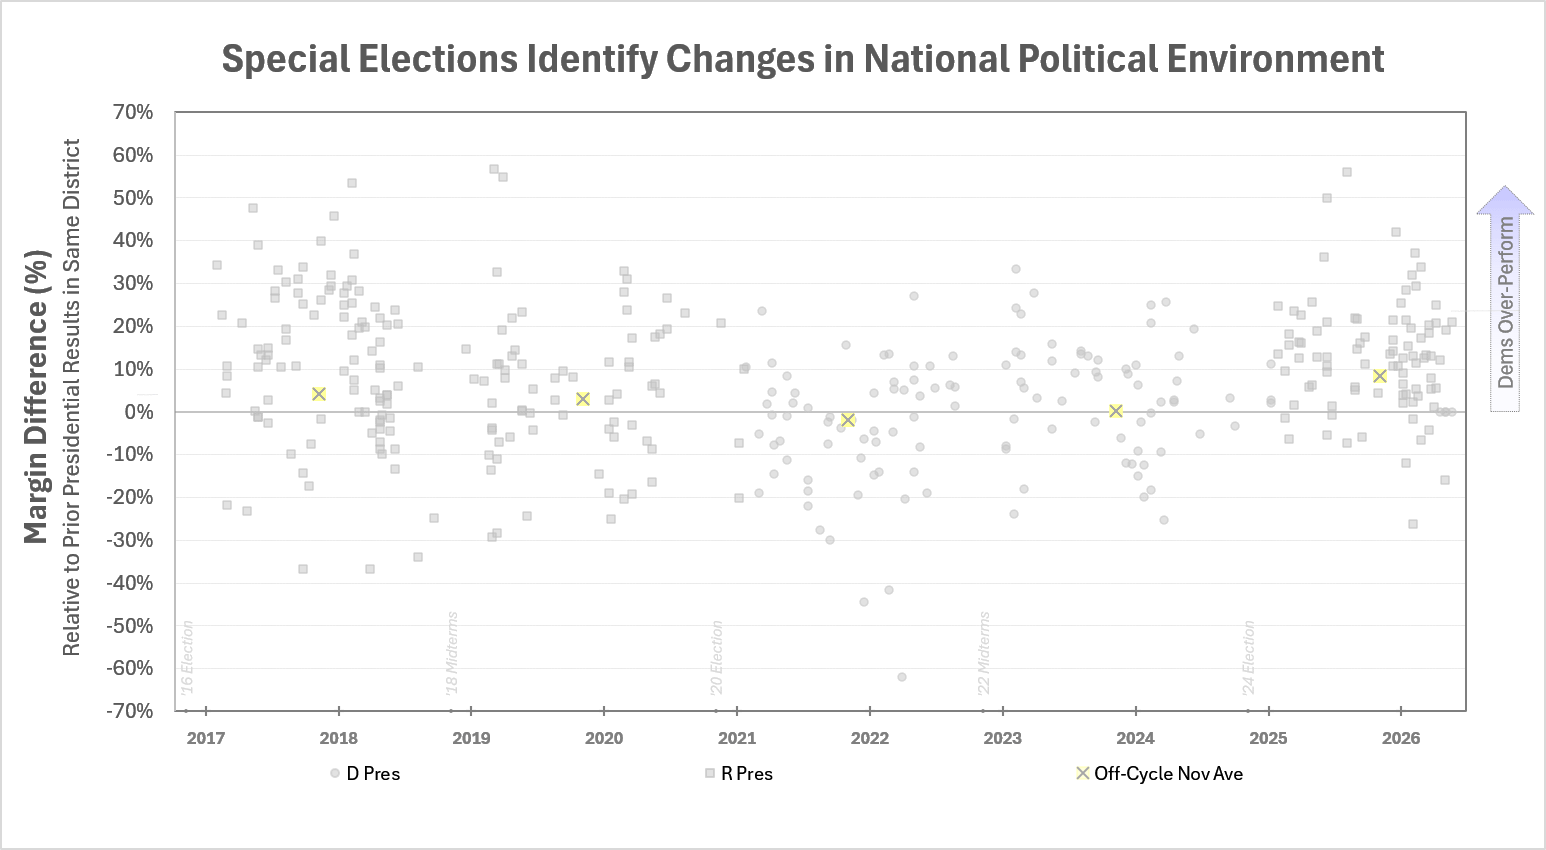
We want to know if there are distinct time periods where we can find break points that demarcate moments of change. To do that, we continually test whether the next set of elections is different from the set before, always asking, “Is this the same, or is it something new?”
We do this in two stages, both of which leverage a basic statistical test that compares two sets of data and tells us, to a degree of confidence, whether they are from the same or different populations.
The first stage requires some judgment and familiarity with the data to determine, with a deliberately low threshold of suspicion, whether it’s possible that something is shifting.
Broadly speaking, we ask, is the relationship between the current population and the one before it changing? More specifically, we look to see whether the average over- or underperformance of recent elections is similar to that of prior elections. If there is nothing inconsistent in recent data with the current population, we keep going, watching as each new set of elections comes in.
Once alerted to the possibility of a shift, we move into the second stage, where we run a much more exhaustive set of tests around the potential boundary between one batch of elections and the next.
We cycle through, date by date, to look for potential inflection points between a known population and a potential new population to determine exactly when a shift has occurred, whether the shift is sustained, and if it is statistically significant enough to define a new period.
With this novel approach, we found that special elections can be broken down into seven distinct periods over the last 10 years. All of these have extremely high levels of confidence—99% or more—according to statistical analysis, with most exceeding 99.9% confidence, and early warning detection as soon as five elections after a shift begins.
These seven periods are highlighted below. Note that we’ve taken the run chart from just above and broken it into three segments to reflect the fact that every four years, our presidential baseline changes as a new election takes place.
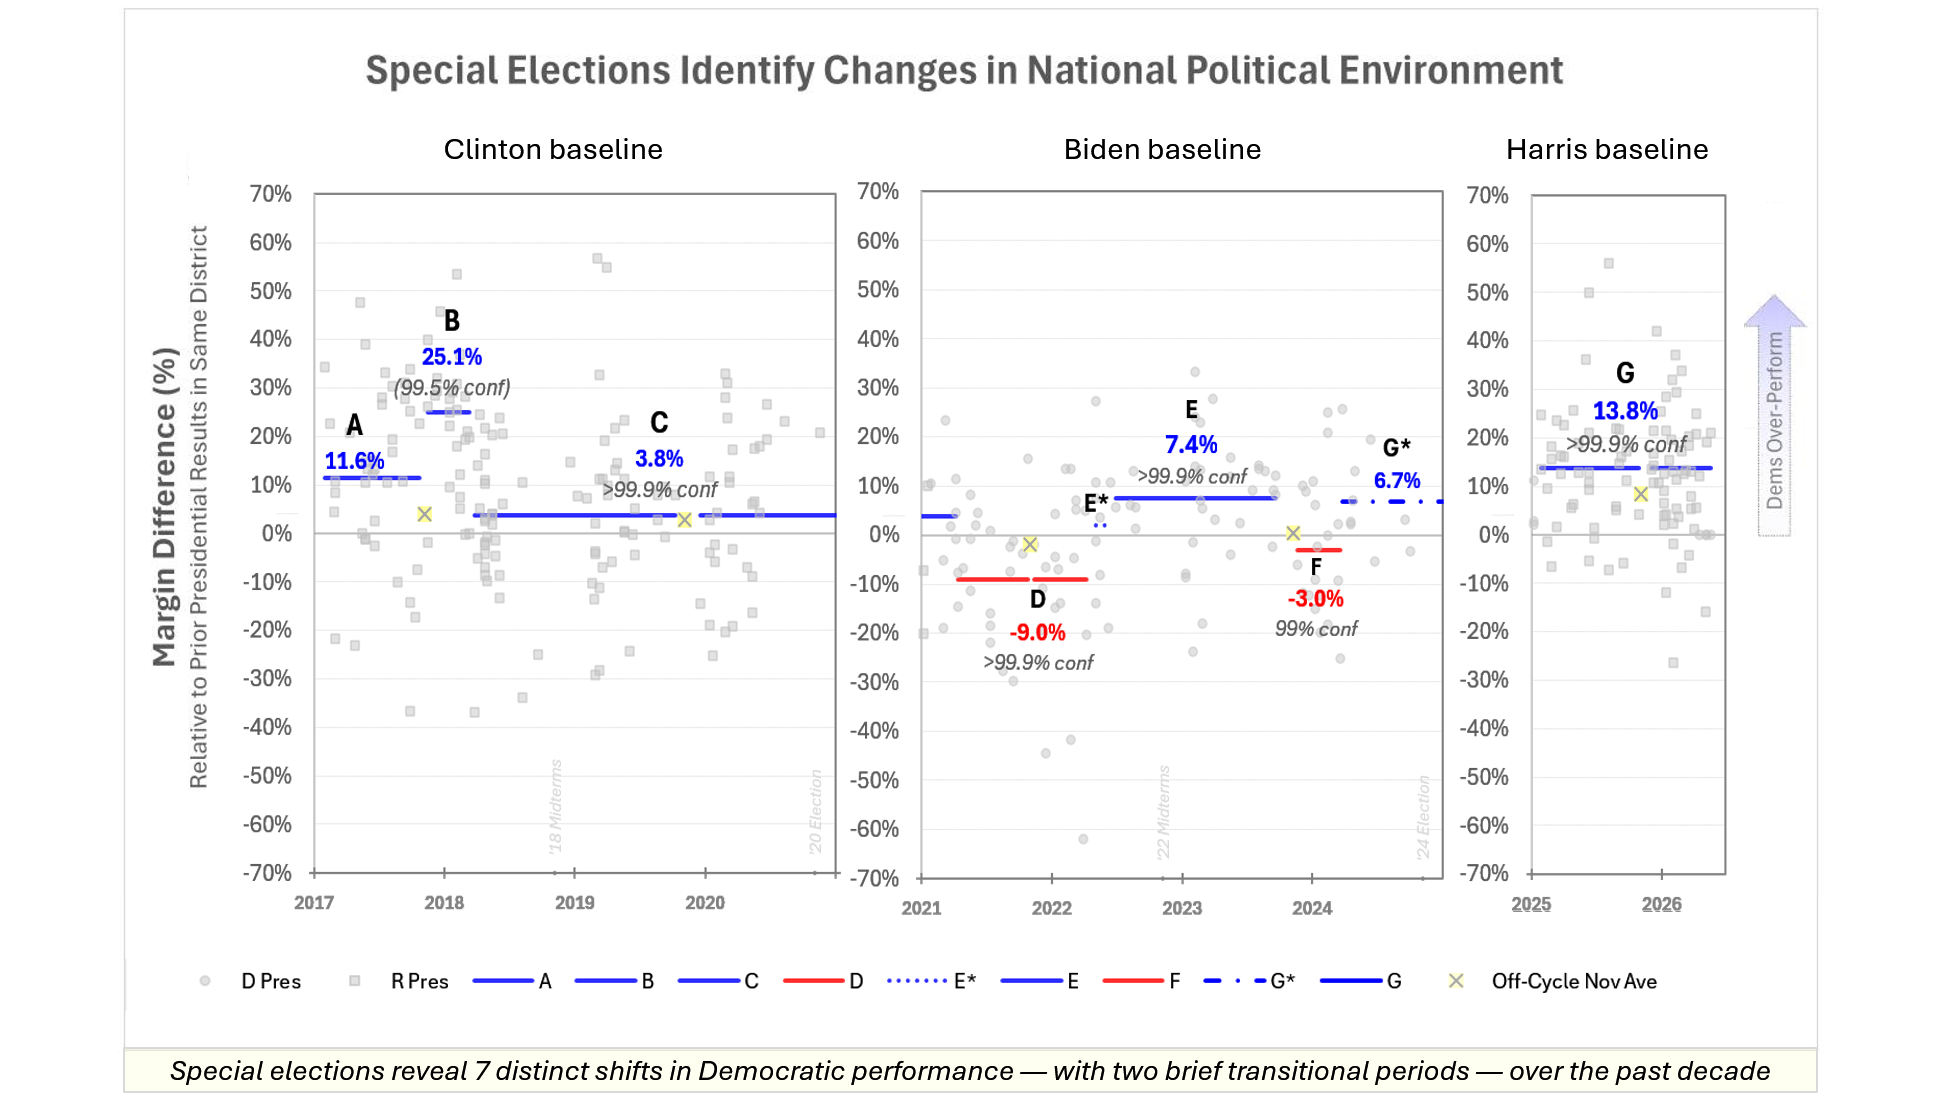
Looking at Trump’s first term, we see it began with Democrats overperforming by nearly 12 points (A). However, just before the end of his first year in office, that overperformance skyrocketed to 25 points (B). That period lasted only four months and included 27 special elections, but we can nonetheless say with high statistical confidence that something had changed.
It so happens that the start of this second segment coincided with the beginning of the #MeToo movement. We can’t prove a direct connection, of course, but the timing is notable.2
Then, around the end of March 2018, we saw a major drop that lasted through the end of Trump’s first term (C). In this cohort, Democrats were overperforming by just 4 points on average, a period that included the 2018 midterms.
After Joe Biden took office, things predictably changed. Just a few months in, Democrats hit a skid that saw them underperform by an average of 9 points, the only such stretch our analysis has uncovered (D).
A year later, though, things changed much less predictably, thanks to the Dobbs surge. This era, which we break into two sub-parts, actually began when the opinion was leaked in early May (E*), nearly two months before it was finally released. Nine special elections occurred between the leak and the decision, enough to know that a shift was underway, but not enough to define a distinct period.
The June 24 Dobbs decision, however, stands on its own as the definitive event that led to the emergence of a new era that saw an average Democratic overperformance of 7 points (E).
Unfortunately for Biden and the Democrats, it didn’t last. At the end of 2023, Democratic overperformances virtually disappeared (F). With less than a year to go before the 2024 general election, the Dobbs high had faded. But not unlike the brief “sugar high” of late 2017 (B), this period (F) was short-lived.
The end of March through the election saw only nine special elections, but despite the small number, the shift back was strong enough that we would have seen it coming. (More on this early-warning system below.) G* represents the transition period between the end of March 2024 and Trump’s second term.
Unsurprisingly, however, Trump’s return to the White House has marked another stretch of Democratic overperformances that have averaged 14% throughout his second term (G).
A new early-warning system
The ability to identify transitions like these offers a powerful tool to political professionals because—and here’s the key takeaway—we can do more than just call them out retrospectively. We can actually flag them in real time, giving us extraordinary insight into whatever may be newly motivating voters.
For instance, with this system in place, we’d have quickly grasped the key shifts leading into the 2024 election. From Democrats’ post-Dobbs over-performance (E) to its fade in late 2023 (F) and rebound (G*) a full seven months before the election, these shifts were all detectable within weeks.
So, within 95% confidence—our criterion for an early-warning trigger—the fade that began in late November was detectable by Jan. 9, 2024. Similarly, the bounceback that began on March 26, 2024, which could have been detected by April 30, just five weeks—and five special elections—later.
Importantly, “party in power” alone can’t always predict what we’re seeing in special elections. Systemic shocks and issue salience can change electoral dynamics quickly, as we saw after #MeToo and Dobbs.
Careful analysis can help confirm when observations of change are indeed “real,” along with what might be triggering them. And with this information, campaigns and donors don’t need to wait for late-cycle polling for validation. Thanks to the data stream that special elections offer, these shifts are often visible months ahead of time.
Perhaps surprisingly, despite the extremely disruptive nature of Trump’s second term, we have yet to see such a shift—and with the midterms now just a few months away, things may hold steady until then or even beyond.
But now that we know what to look for—and how to look for it—we can identify any significant changes soon after they happen. That information will be of major value to anyone involved in politics, and we’ll share it with you just as soon as our new tools alert us.
Notes on methodology:
Framework: Tools from process management were used to evaluate changes in Democratic overperformance in special elections. Process management tools can identify statistically significant changes in real-time observations to allow organizations to adapt to events as they occur. Techniques used here include Six Sigma and statistical process control, as well as a new boundary identification method we developed to quickly determine when shifts occur. This innovation—both using existing statistical methods and adding a new approach to boundary determination—offers a powerful tool going forward.
Evaluating individual special elections: Basic population distribution statistics are used to demonstrate how large a shift in an individual special election needs to be to be considered an unusual event.
Population analysis: Welch (Type 3) two-sample t-tests in Excel with extensive boundary testing are used to identify population shifts (see decision criteria below). The approach was validated using R statistical software. Other statistical tests, such as median, effect size, sample size, and trend testing, are used to confirm t-test findings and occasionally provide additional context. For particularly short periods and smaller shifts that don’t meet the full decision criteria, a transitional period may be defined. Applying statistical methods yields greater insight than previously reported, including distinct periods.
Decision criteria:
Trigger detection: At least five elections must have taken place since a suspected shift, and they must achieve 95% confidence via t-test.
Confirmation: Sustained 99% confidence for at least five elections to confirm a shift has occurred, or sustained 95% confidence with an effect size of .5 or greater. This means the shift is so large that it is half a standard deviation of the whole population, or nearly 9 points.
Inclusions and exclusions/minimizing noise: All 438 special elections reported by The Downballot between Jan. 20, 2017, and May 19, 2026 that met the site’s criteria (only one D candidate and one R candidate on the ballot in a partisan election; D and R candidates combined receive >90% of the vote) are included. Off-year November elections that occur on the Tuesday after the first Monday in November in odd-numbered years were segmented out and evaluated separately for mean, median, and standard deviation. This was done to maximize signal and minimize noise.
We’ve segmented out special elections that occur simultaneously with odd-year November general elections in states like Virginia to maximize our signal, as we believe these may behave differently.
There’s another caveat: Some states appear to be more favorable to Democrats than others, and those states may have been overrepresented in this period.
Very nice. Reminds me of work on automatic early detection of recessions by Jim Hamilton.
https://econbrowser.com/archives/2026/04/a-worried-econ-watcher
Fascinating overview of processes and methodology. Thank you for sharing this, I look forward to reading more!