


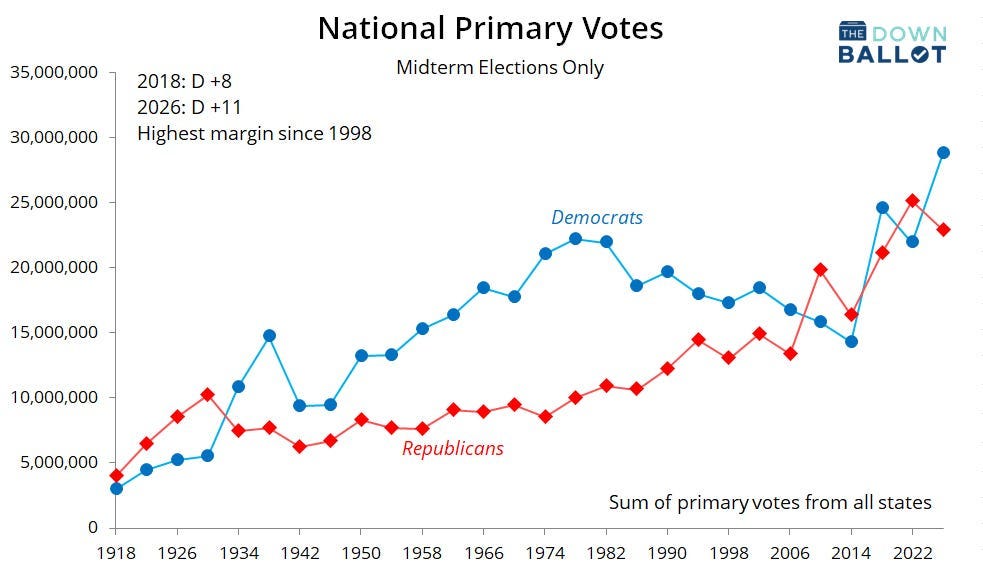
Throughout this year’s just-concluded primary season, there’s been one consistent storyline: Democratic primaries have seen much higher turnout than their Republican counterparts. But does this meaningfully indicate what we might expect in November?
It turns out the answer is very much yes.
In midterms over the past 80 years, there’s been a surprisingly tight relationship between voting behavior in a given cycle’s primaries and the House popular vote in the general election that follows. Based on that relationship, this year’s primary turnout suggests that Democrats would win the House vote by an enormous 13-point spread.
That’s much larger than what the generic congressional ballot forecasts. That metric, according to a polling aggregate calculated by FiftyPlusOne, currently gives Democrats a smaller 7-point edge.
Either would be more than enough for Democrats to take back the House, and neither outcome would be surprising. Both measures have great predictive power, but like any other forecasting tool, they both come with uncertainty attached to them.
Below we’ll explain what precisely the primary results are telling us, and why they matter. The bottom line is that Democrats need to be prepared to capitalize on the potential for an electoral tsunami on Nov. 3.
Uncovering the national primary
Assessing a state’s total primary turnout in midterm years is not as straightforward as it might seem, however. That’s because every state hosts a mix of different races, and for many contests, it might not even hold a primary at all.
As we gathered data, we had some choices to make. We decided to start with elections for governor, which are the most common type of statewide election in midterm years. If a state didn’t hold a gubernatorial primary in a given year, we then looked to see if there was a primary for U.S. Senate.
Failing that, we moved on to any other statewide races, then the total for all U.S. House races, then the total for all state legislative races, and finally, the total for as many county-level races as possible. Sometimes, we had to mix and match, using, say, a Democratic primary for governor and a Republican primary for Senate. On rare occasions, we were unable to find any data at all, but any gaps are largely immaterial.
With robust data at hand stretching back almost all the way to when the 17th Amendment began mandating the direct election of senators nationwide, we developed the graph at the top of this post. It shows the total number of Democratic and Republican votes across all state primaries from 1918 to 2026, in midterm years only. We’ve dubbed this the “national primary.”
We can see a century of dramatic political history playing out in the graph above: a tripling of Democratic primary votes from 1930 to 1938 following the end of the Progressive Era and the birth of the New Deal; the mid-century domination of the Democratic Party, when it comprised an uneasy coalition of southern segregationists and northern moderates and liberals; the long, slow realignment from the Civil Rights Era to Barack Obama’s presidency; a surge in turnout for both parties since 2014 that well outpaces population growth; and the recent see-sawing lead, ending with the domination of the 2026 cycle by Democrats.
Taking it one step further, we can calculate a percentage vote share for Democrats and Republicans in this synthetic national primary, then take the difference between the two. The chart below shows that difference for every midterm since 1918.
